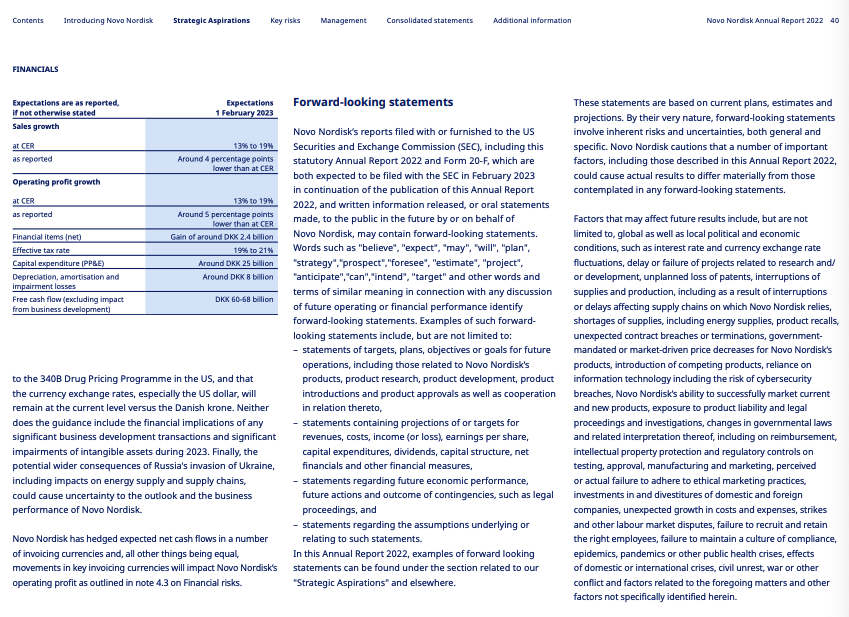
The performance overview section of the annual report presents an analysis of financial, operational, and sustainability performance. It is an opportunity for management to be accountable for how the company has performed and to share their analysis of the drivers of performance, including key performance indicators. Quantitative performance information is particularly relevant to investors in their comparison and valuation of companies.
Insight: The performance overview is often presented as an introduction from the CEO, CFO, or board chair, and it can be presented together with the strategy overview.
Analysis of Financial and Nonfinancial Performance
This section of the overview provides a narrative from management, introducing the financial and sustainability statements. This includes an overview of:
- Operational and financial results;
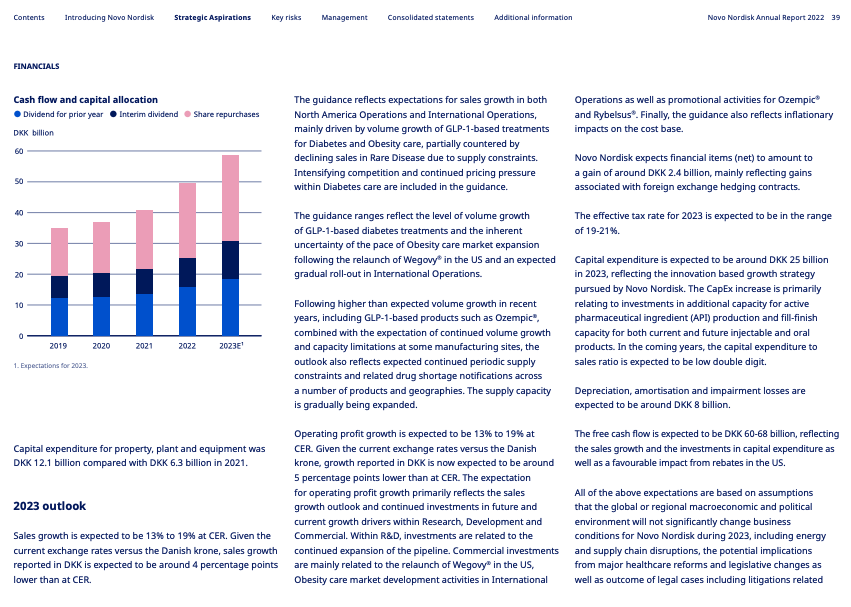
- Liquidity and capital requirements;
- Investments and initiatives;
- Intangibles;
- Material changes and future trends;
- Forward-looking information;
- Sustainability performance.
Analysis of Key Performance Indicators
Reporting on key performance indicators (KPIs) that are set during the strategy-setting process provides performance analysis that is highly relevant and unique to the company’s business model and context, strategy, and the material risks it faces. This includes financial, operational, and sustainability KPIs.
Note: KPIs are a subset of the full set of metrics that are reported in the financial and sustainability statements.
Operational and Financial Results - Include major components of revenue and costs (segment information) and factors that led to changes in items of the income statement.
Liquidity and Capital Requirements - Describe financing needs and plans, including liquidity and capital requirements, and how cash flows through the organization.
Investments and Initiatives - Describe the performance of investments and how it fits into the wider performance, along with risks associated with investments.
Sustainability - Provide contextual and qualitative information on key sustainability issues for the company, introducing quantitative results in the sustainability statements.
Intangibles - List and describe nonfinancial resources that are material for performance (brand recognition, reputation, customer lists, patents, trademarks, copyrights).
Material Changes or Trends - Discuss material changes in operational or financial performance and driving forces, including how environmental, social, and governance (ESG) factors have impacted operational and financial performance.
Forward-Looking Information - Provide guidance on how the company will perform and what will be the key drivers of this performance.


Reporting on KPIs set during the strategy-setting process requires an analysis that is relevant and unique to the company’s business model and context, strategy, and the material risks it faces.
Financial KPIs
Measure the performance in managing financial capital and resources and generating a profit for investors. This includes the following:
- Items of financial statements (for example, sales; earnings before interest, taxes, depreciation, and amortization; earnings per share);
- Commonly used financial ratios, such as price-to-earnings ratio and total shareholder returns.
Operational KPIs
Measure the efficiency of operations and delivery of products and services, both generic and sector-specific.
Examples of generic KPIs:
- Capacity and utilization;
- Customer satisfaction;
- Employee turnover.
Examples of industry KPIs:
- Churn rate (Telecom);
- Sales per square foot (Retail);
- Assets under management (Finance).
Sustainability KPIs
Disclose the KPIs used to assess and manage material sustainability-related risks and opportunities.